Wizard Mentor
Wizard Mentor
- Joined
- Oct 22, 2008
- Messages
- 14,669
- Likes
- 14,920
- Points
- 113
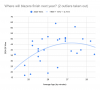
Background: Older teams generally do better than younger teams.... up to a point. So, let's look at wins vs. team age for the year 2024/25. How did different teams do considering their age? How did the blazers do? Which teams are expected to get better, which teams are expected to get worse? A quick mathematical analysis with some definite assumptions (like no trades...), but interesting anyway. OKC is a humongous outlier so I through them out. If you throw out the high, you should throw out the low, so I did (Pels).
Data:

Blazers were far left on graph.
2024/25 Analysis:
Blazers wins (age 24.3): 36
NBA expected average wins (for teams age 24.3): 22 (stretched graph and eyeballed, using formula doesn't work probably because of sig figs).
So, Blazers finished 14 wins above what would be expected from the youngest team in the league!
2025/26 (predictions):
Age: 25.3
Expected NBA wins for age 25.3: 22 -> 36
Expected Blazers wins: 36+14 = 50
Visually: Imagine moving graphed line straight up until it goes through this years Blazers data point (far left), then look at where that moved graph is for a 25.3 year old team.
Interesting results:
So, how is this team supposed to improve by 14 games this season? The interpolation assumes the core piece stay the same - Internal Improvement. That's why the model has the younger teams improving at a higher rate than the older team, which is sensible.
Data:
Blazers were far left on graph.
2024/25 Analysis:
Blazers wins (age 24.3): 36
NBA expected average wins (for teams age 24.3): 22 (stretched graph and eyeballed, using formula doesn't work probably because of sig figs).
So, Blazers finished 14 wins above what would be expected from the youngest team in the league!
2025/26 (predictions):
Age: 25.3
Expected NBA wins for age 25.3: 22 -> 36
Expected Blazers wins: 36+14 = 50
Visually: Imagine moving graphed line straight up until it goes through this years Blazers data point (far left), then look at where that moved graph is for a 25.3 year old team.
Interesting results:
- Once your average age is 27.2, you are expected to get worse, which makes some sense. So, the teams that were older than 26.2 THIS year are expected to get worse NEXT year (unless they do something to get younger).
- 12 teams finished below the curve, 16 teams (including the blazers) finished above. Including okc and and pels, it would be 13 and 17. The reason? Some of the teams that did bad did REALLY bad.
- Teams with 40 wins or less (teams above the line are in red, Blazers are way above the curve):
Utah Jazz
Washington Wizards
Charlotte Hornets
Philadelphia 76ers
Brooklyn Nets
Toronto Raptors
San Antonio Spurs
Portland Trail Blazers
Phoenix Suns
Miami Heat
Chicago Bulls
Dallas Mavericks
Atlanta Hawks
Sacramento Kings - If I took out the top 3 and the bottom3 teams, the data would probably be a little more accurate (okc, cleveland, boston and charlotte, philly, phoenix)
- I used nbaage.com for age data. Used Average Age by Minutes (not usage). Check nbaage.com if you want to know which team is represented by a given data point.
- 3 oldest teams:
Los Angeles Clippers
Golden State Warriors
Phoenix Suns - 3 youngest teams:
Portland Trail Blazers
Brooklyn Nets
Utah Jazz - Example: Both the Hawks (age: 25.8) and the Kings (age: 27.7) had 40 wins. Hawks are expected to do much better than the Kings next season.
So, how is this team supposed to improve by 14 games this season? The interpolation assumes the core piece stay the same - Internal Improvement. That's why the model has the younger teams improving at a higher rate than the older team, which is sensible.
Attachments
Last edited:

