Rx2web
Member
- Joined
- Oct 18, 2008
- Messages
- 40
- Likes
- 9
- Points
- 8
I’ve wanted to share this for a while but well I’ve held off. So please read and pardon the length I think it’s worth the read.
Let me give you a little background to what I’m going to be talking about. First of all, this all started a year ago because of my desire to see Portland finish out the season strong. I created a spreadsheet that I listed out the last 15 games of the season for Portland lifted straight from ESPN.com’s Blazer schedule and made columns for my predicted wins and losses and a column for my notes as to why I thought they would win or lose. So I followed by sheet for the remainder of the season and watched Portland come out at 41-41. That was really cool to me and yet I swiftly forgot about this till the next season started.
I created a new sheet for the new season that had the entire season listed, had a place to put in my predictions and then a place to put in the end result so I could follow my predictions for the whole season. At the time I was excited about this and wanted to share it. I posted it here. I was trashed for posting it because it was an excel file with a macro and people’s flags went up about it being a virus. I understand the virus thing, I didn’t like peoples trashing me because I was a “lurker” here who rarely posted. Even though I’ve lurked and followed the people migration from the ESPN boards, to BBF to here.
Anyway, As the season progressed, I found myself studying the sheet and wanting to know more information. I wanted to be able to look at the numbers and better understand Portlands place in things and how their season would come out. Partially to help sooth my soul after a loss and something to trumpet to my co workers when we won, I expanded the workbook all season long. Now it is comprised of seven distinct sheet sections that track and monitor different pieces of information.
1 - Win Loss Record
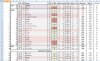
This is the original sheet for this season with a few new modifications. Here I’ve got the entire Portland season with columns for:

• Game Number
• Game Date
• Home/Away
• # of Days Rest
• Opponent
• Opponent Conference (E/W)
• Predicted Win/Loss
• Predicted Win Total
• Predicted Loss Total
• Actual Win/Loss
• Actual Win Total
• Actual Loss Total
• Actual Win Percentage
• Opponent Win Percentage
• Prediction Accurate (Y/N)
Really once the season started all I had to do was put in a W or L in the Actual column and let the sheet do the rest. It fills in the details and colors things accordingly. Which was nice. I can glance at it and see the whole schedule quickly. I even segmented it with markers for ¼ season, ½ season, ¾ season and All Star Break. I also delineated the separation of months as well for additional tracking that will be discussed later.
My need for more information, or really an analysis of what I had collected on that first sheet prompted me to make an additional one.
2 - Records Vs.
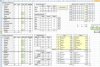
The Records Vs. sheet is where I did most of my number crunching. We all hear stats rattled off at us on every sports show, pregame, post game, game commentator… They are everywhere. I wanted to use what I had collected to give me a birds eye view of how Portland was doing. So I turned my data into a collection of tables.
• Western Conference Standings - with team by team win/loss, total games against and total games remaining.
• Eastern Conference Standings - with team by team win/loss, total games against and total games remaining.
• Vs East or West – Win and Losses broken down by Conference
• Monthly records – Wins and losses broken down by month with monthly win percentage.
• Rest records – wins and losses based on number of days of rest
• Home records – Our wins and losses at home, sub categorized by east vs west.
• Away record – our wins and losses while Away, sub categorized by east vs west.
• An alternate view of the NBA standings broken down by playoffs or non-playofs and number of games remaining.
• Win Loss Record vs Percentages. I made a dynamic table that scans the teams and groups them into levels, .800, .700, .600…. tells me how many teams are in each level, how many wins and losses we have against teams in that level, what our winning percentage is against the level, and how many games remain against that level. Then based on that winning percentage and the number of games remaining I calculate out a projected number of wins of remaining games to total up into a projected win total for the season. (Currently sits at 52)
• Then I totaled things up wins and losses of teams above and below .500.

As you can tell there is a lot of information going on here that just provides hope. As the season progressed I tweaked this so that the team that we are playing next is highlighted automatically so I can tell that the next game is against the Pacers, a .412 team, it’s out last game against them, we are 1-0 against them so far this season, 9-4 against the east in away games, 6-3 in March, 25-14 with 1 day of rest, and 9-1 against .400 level teams this season. We have 2 games remaining against the .400 level and we are projected to win both.
3 - RAW Data
Developing at the same time as the Records Vs. was another sheet that provided some additional data that wasn’t on the Portland schedule. I needed to have each of the teams, their win and loss records and their winning percentage. This information changed daily and I needed it to filter/sort rankings to make some of the lists on the Records Vs. page. I found a website that published free each night an XML feed with the nightly standings that contained all the information that I was looking for. So I wrote a macro that when a button is clicked it goes out and grabs the XML and then updates the sheet and filters and sorts the data. So really that is all that is there and I really don’t spend any time there to look at information. I just go there to push the button once a day to update my opponent team stats.
4 & 5 - Player Stats & Game Info
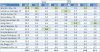
About a month ago I was looking at my sheet and was rather proud of where it was at. But I still felt that it was lacking. There was a wealth of information that I wasn’t including in this. I was looking at the next game, a home game against I think it was the Lakers. I could make a guess on how the team would do but what about individual players? Why not add player statistics? I could have their stats and base them off all the key categories that I’ve already done for the Records Vs. section. It seemed like a LOT of work so I didn’t do it at first. But then I hit a long weekend and I found myself going through the box scores of the season and just collecting the data and combining it with the game number from the first sheet. So then I could see all the stats for Brandon Roy, against say Houston. So I created some dynamic pivot tables that use these stats and combine them based on a drop down selection. I can look at the player stat averages based on, wins, losses, home, away, east, west, all games.

It was pretty easy then to expand that into an additional table with extended stats with shooting percentages and makes and attempts. I also made a third table showing totals for all the main categories instead of averages all of these keyed to the same drop down selection.

The last pivot table I made was based off of the initial one with player stat averages, but this time I made the drop down select individual teams rather then home/away etc. Now I could get really granular and see that Brandon Roy averaged X number of points against the west and Y number of points against the Spurs. This was really exciting to me. Having the raw data allows me to then make all sorts of comparisons if I wanted to for better understanding how Portland is going to do against a given team.
Let me give you a little background to what I’m going to be talking about. First of all, this all started a year ago because of my desire to see Portland finish out the season strong. I created a spreadsheet that I listed out the last 15 games of the season for Portland lifted straight from ESPN.com’s Blazer schedule and made columns for my predicted wins and losses and a column for my notes as to why I thought they would win or lose. So I followed by sheet for the remainder of the season and watched Portland come out at 41-41. That was really cool to me and yet I swiftly forgot about this till the next season started.
I created a new sheet for the new season that had the entire season listed, had a place to put in my predictions and then a place to put in the end result so I could follow my predictions for the whole season. At the time I was excited about this and wanted to share it. I posted it here. I was trashed for posting it because it was an excel file with a macro and people’s flags went up about it being a virus. I understand the virus thing, I didn’t like peoples trashing me because I was a “lurker” here who rarely posted. Even though I’ve lurked and followed the people migration from the ESPN boards, to BBF to here.
Anyway, As the season progressed, I found myself studying the sheet and wanting to know more information. I wanted to be able to look at the numbers and better understand Portlands place in things and how their season would come out. Partially to help sooth my soul after a loss and something to trumpet to my co workers when we won, I expanded the workbook all season long. Now it is comprised of seven distinct sheet sections that track and monitor different pieces of information.
1 - Win Loss Record
This is the original sheet for this season with a few new modifications. Here I’ve got the entire Portland season with columns for:
• Game Number
• Game Date
• Home/Away
• # of Days Rest
• Opponent
• Opponent Conference (E/W)
• Predicted Win/Loss
• Predicted Win Total
• Predicted Loss Total
• Actual Win/Loss
• Actual Win Total
• Actual Loss Total
• Actual Win Percentage
• Opponent Win Percentage
• Prediction Accurate (Y/N)
Really once the season started all I had to do was put in a W or L in the Actual column and let the sheet do the rest. It fills in the details and colors things accordingly. Which was nice. I can glance at it and see the whole schedule quickly. I even segmented it with markers for ¼ season, ½ season, ¾ season and All Star Break. I also delineated the separation of months as well for additional tracking that will be discussed later.
My need for more information, or really an analysis of what I had collected on that first sheet prompted me to make an additional one.
2 - Records Vs.
The Records Vs. sheet is where I did most of my number crunching. We all hear stats rattled off at us on every sports show, pregame, post game, game commentator… They are everywhere. I wanted to use what I had collected to give me a birds eye view of how Portland was doing. So I turned my data into a collection of tables.
• Western Conference Standings - with team by team win/loss, total games against and total games remaining.
• Eastern Conference Standings - with team by team win/loss, total games against and total games remaining.
• Vs East or West – Win and Losses broken down by Conference
• Monthly records – Wins and losses broken down by month with monthly win percentage.
• Rest records – wins and losses based on number of days of rest
• Home records – Our wins and losses at home, sub categorized by east vs west.
• Away record – our wins and losses while Away, sub categorized by east vs west.
• An alternate view of the NBA standings broken down by playoffs or non-playofs and number of games remaining.
• Win Loss Record vs Percentages. I made a dynamic table that scans the teams and groups them into levels, .800, .700, .600…. tells me how many teams are in each level, how many wins and losses we have against teams in that level, what our winning percentage is against the level, and how many games remain against that level. Then based on that winning percentage and the number of games remaining I calculate out a projected number of wins of remaining games to total up into a projected win total for the season. (Currently sits at 52)
• Then I totaled things up wins and losses of teams above and below .500.
As you can tell there is a lot of information going on here that just provides hope. As the season progressed I tweaked this so that the team that we are playing next is highlighted automatically so I can tell that the next game is against the Pacers, a .412 team, it’s out last game against them, we are 1-0 against them so far this season, 9-4 against the east in away games, 6-3 in March, 25-14 with 1 day of rest, and 9-1 against .400 level teams this season. We have 2 games remaining against the .400 level and we are projected to win both.
3 - RAW Data
Developing at the same time as the Records Vs. was another sheet that provided some additional data that wasn’t on the Portland schedule. I needed to have each of the teams, their win and loss records and their winning percentage. This information changed daily and I needed it to filter/sort rankings to make some of the lists on the Records Vs. page. I found a website that published free each night an XML feed with the nightly standings that contained all the information that I was looking for. So I wrote a macro that when a button is clicked it goes out and grabs the XML and then updates the sheet and filters and sorts the data. So really that is all that is there and I really don’t spend any time there to look at information. I just go there to push the button once a day to update my opponent team stats.
4 & 5 - Player Stats & Game Info
About a month ago I was looking at my sheet and was rather proud of where it was at. But I still felt that it was lacking. There was a wealth of information that I wasn’t including in this. I was looking at the next game, a home game against I think it was the Lakers. I could make a guess on how the team would do but what about individual players? Why not add player statistics? I could have their stats and base them off all the key categories that I’ve already done for the Records Vs. section. It seemed like a LOT of work so I didn’t do it at first. But then I hit a long weekend and I found myself going through the box scores of the season and just collecting the data and combining it with the game number from the first sheet. So then I could see all the stats for Brandon Roy, against say Houston. So I created some dynamic pivot tables that use these stats and combine them based on a drop down selection. I can look at the player stat averages based on, wins, losses, home, away, east, west, all games.
It was pretty easy then to expand that into an additional table with extended stats with shooting percentages and makes and attempts. I also made a third table showing totals for all the main categories instead of averages all of these keyed to the same drop down selection.
The last pivot table I made was based off of the initial one with player stat averages, but this time I made the drop down select individual teams rather then home/away etc. Now I could get really granular and see that Brandon Roy averaged X number of points against the west and Y number of points against the Spurs. This was really exciting to me. Having the raw data allows me to then make all sorts of comparisons if I wanted to for better understanding how Portland is going to do against a given team.