- Joined
- Oct 5, 2008
- Messages
- 129,636
- Likes
- 150,112
- Points
- 115
Follow along with the video below to see how to install our site as a web app on your home screen.
Note: This feature may not be available in some browsers.
No, not fun. Pisses me off!
Check this out!
I get Bradley Beal and Perry Jones a lot. Harrison Barnes comes up a few times too. Haven't gotten the #1 pick yet. Got #2 once though.
Me too. I'd love to get Jones at 10, but I'm not sold on Beal at 4. Florida plays tonight at 7:15, and it's been a few years since we as Blazer fans have had a reason to watch the high lottery picks in action during the NCAA tournament.
Wonder what the odds are of our pick slipping into the Top 3, and NJ's ending up at 4? Wouldn't that be sweet!
New Jersey literally won the lottery 5 times in a row for me just now...
^AAAAAAGGGGGHHHHHHHH This nerd chart means nothing to me son! I don't understand it!
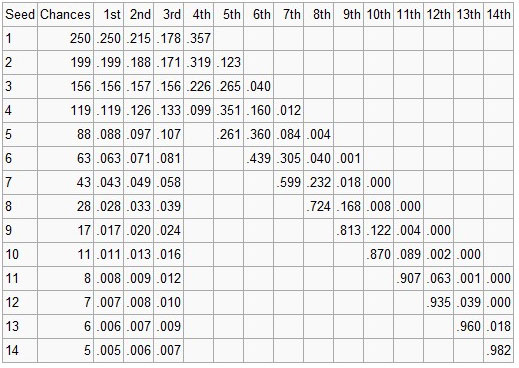
Close, mags. The 35% (you took 1-.65) is the probability of the Nets getting 1st, 2nd, or 3rd. Te probability of them getting 4th, 5th, or 6th then is jusst 1-the previous value (or 65%). The guy made it even better by color coding the probability of getting each of those picks. ~10% is the prob of them getting 4th if they have the 4th worst record. Actually, if they do have the 4th worst record, they have more of a chance of getting the 5th pick than anything else (35%).
Here is another resource to bookmark:
HAHA! You and your in-home DeVry Institute 2-year degree!Dude it's easy to read. Probably your son would understand it. On the left column, it has 0.1, 0.2, etc... That is saying 10%, 20%, etc. Then you look at the color chart to show the pick. So the blue is 4th pick, red is 5th and green is 6th. Then the numbers at the bottom mean what position the team is in. For example: If it's 1, then NJ was the worst team in the NBA.
So looking at the "Nerd Chart", if NJ is the worst team, then we have a 35% chance to get their #4 pick. There isn't any other picks, because that is their worst case scenario; which would be our best case scenario. If NJ was the 3rd worst team in the NBA, then we have 23% chance of getting #4, 48% chance of getting 5th, and a 53% chance of getting 6th.
HAHA! You and your in-home DeVry Institute 2-year degree!