For what it's worth, the UK's Met Office/Hadley Centre that generated the numbers used in your plot seems to have little doubt about this issue. See:
http://www.metoffice.gov.uk/climatechange/guide/bigpicture/
Summary here:
Climate change facts
--------------------------------------------------------------------------------
Fact 1
Climate change is happening and humans are contributing to it.
--------------------------------------------------------------------------------
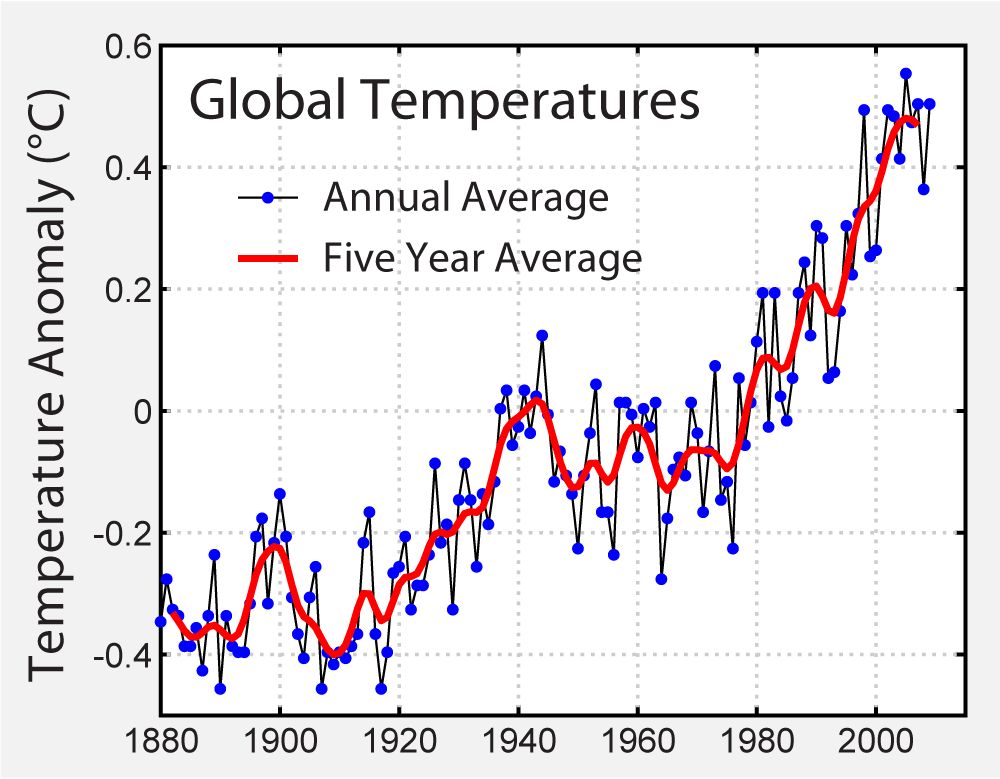
Fact 2
Temperatures are continuing to rise.
--------------------------------------------------------------------------------
Fact 3
The current climate change is not just part of a natural cycle.
--------------------------------------------------------------------------------
Fact 4
Recent warming cannot be explained by the Sun or natural factors alone.
--------------------------------------------------------------------------------
Fact 5
If we continue emitting greenhouse gases this warming will continue and delaying action will make the problem more difficult to fix.
--------------------------------------------------------------------------------
Fact 6
Climate models predict the main features of future climate.
Climate change mythsMyth 1
The intensity of cosmic rays changes climate.
--------------------------------------------------------------------------------
Myth 2
Drop in monthly global temperature means global warming has stopped.


 ty barfo